March 26th, 2026
New
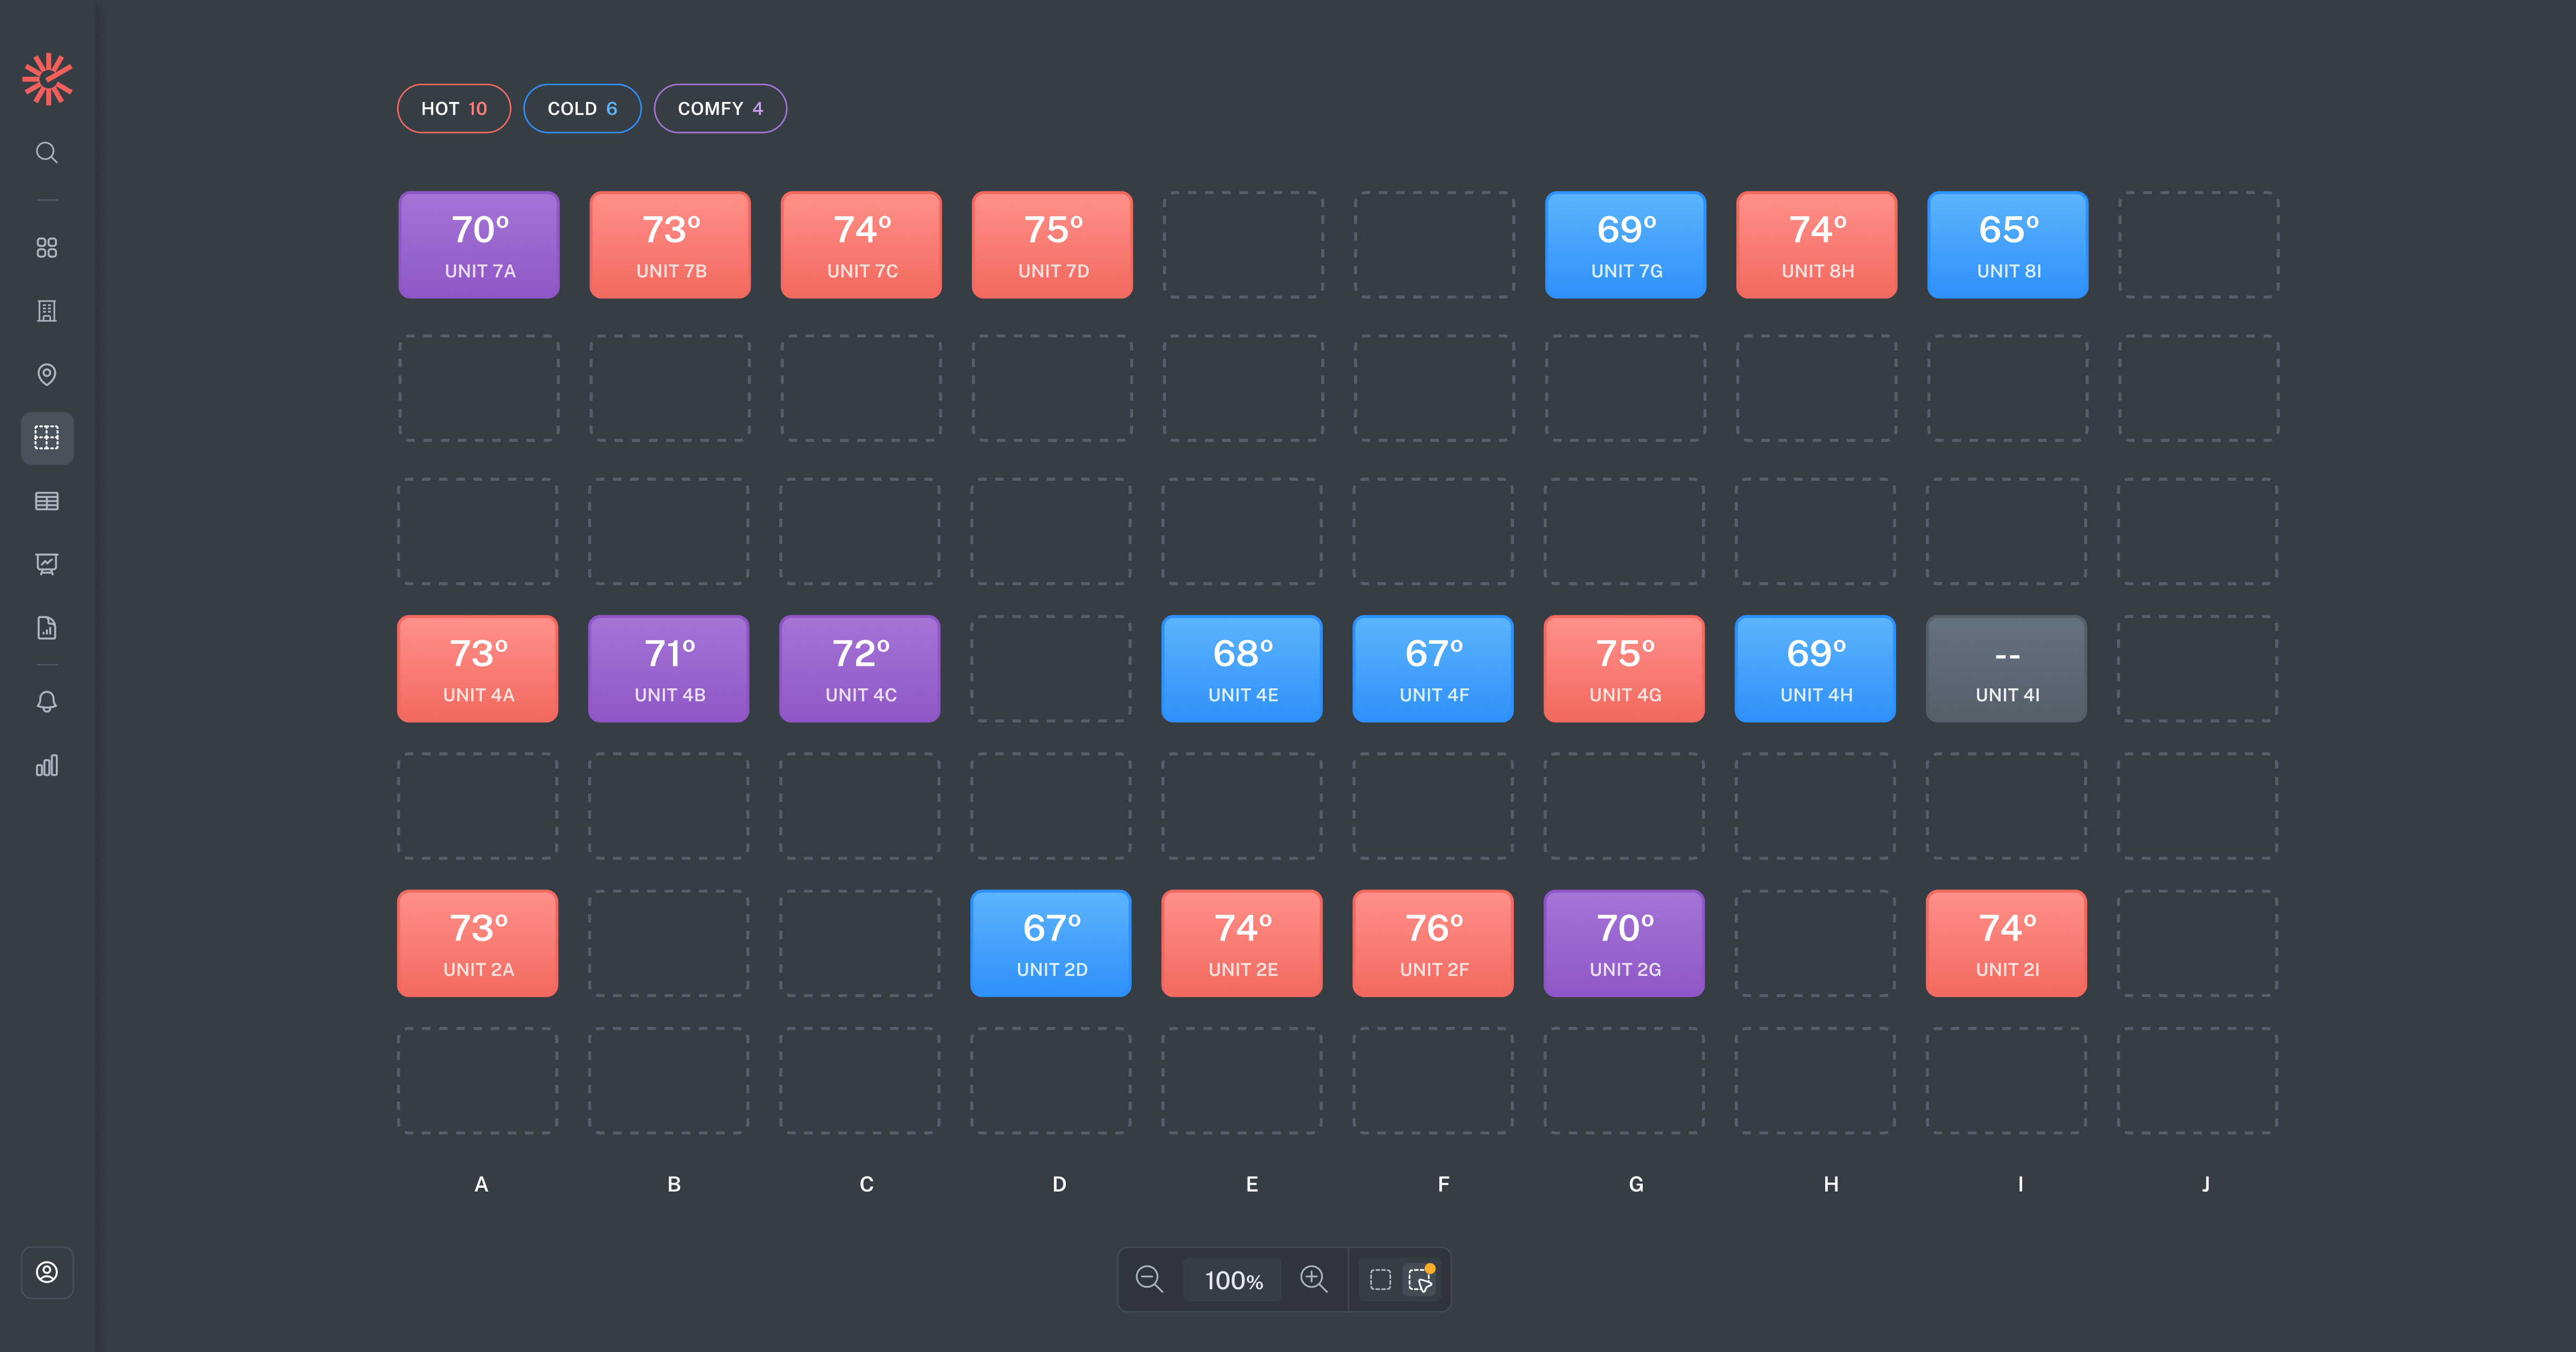
Building Map
Visualize your entire building at a glance with a map that shows exactly where your sensors are located. Each sensor is color-coded based on its current reading, giving you an immediate sense of temperature distribution, highlighting patterns or problematic sensors.
Instead of scanning through data points, you can now quickly understand what’s happening across the building and pinpoint where your attention is needed.
Write a comment...