March 26th, 2026
New
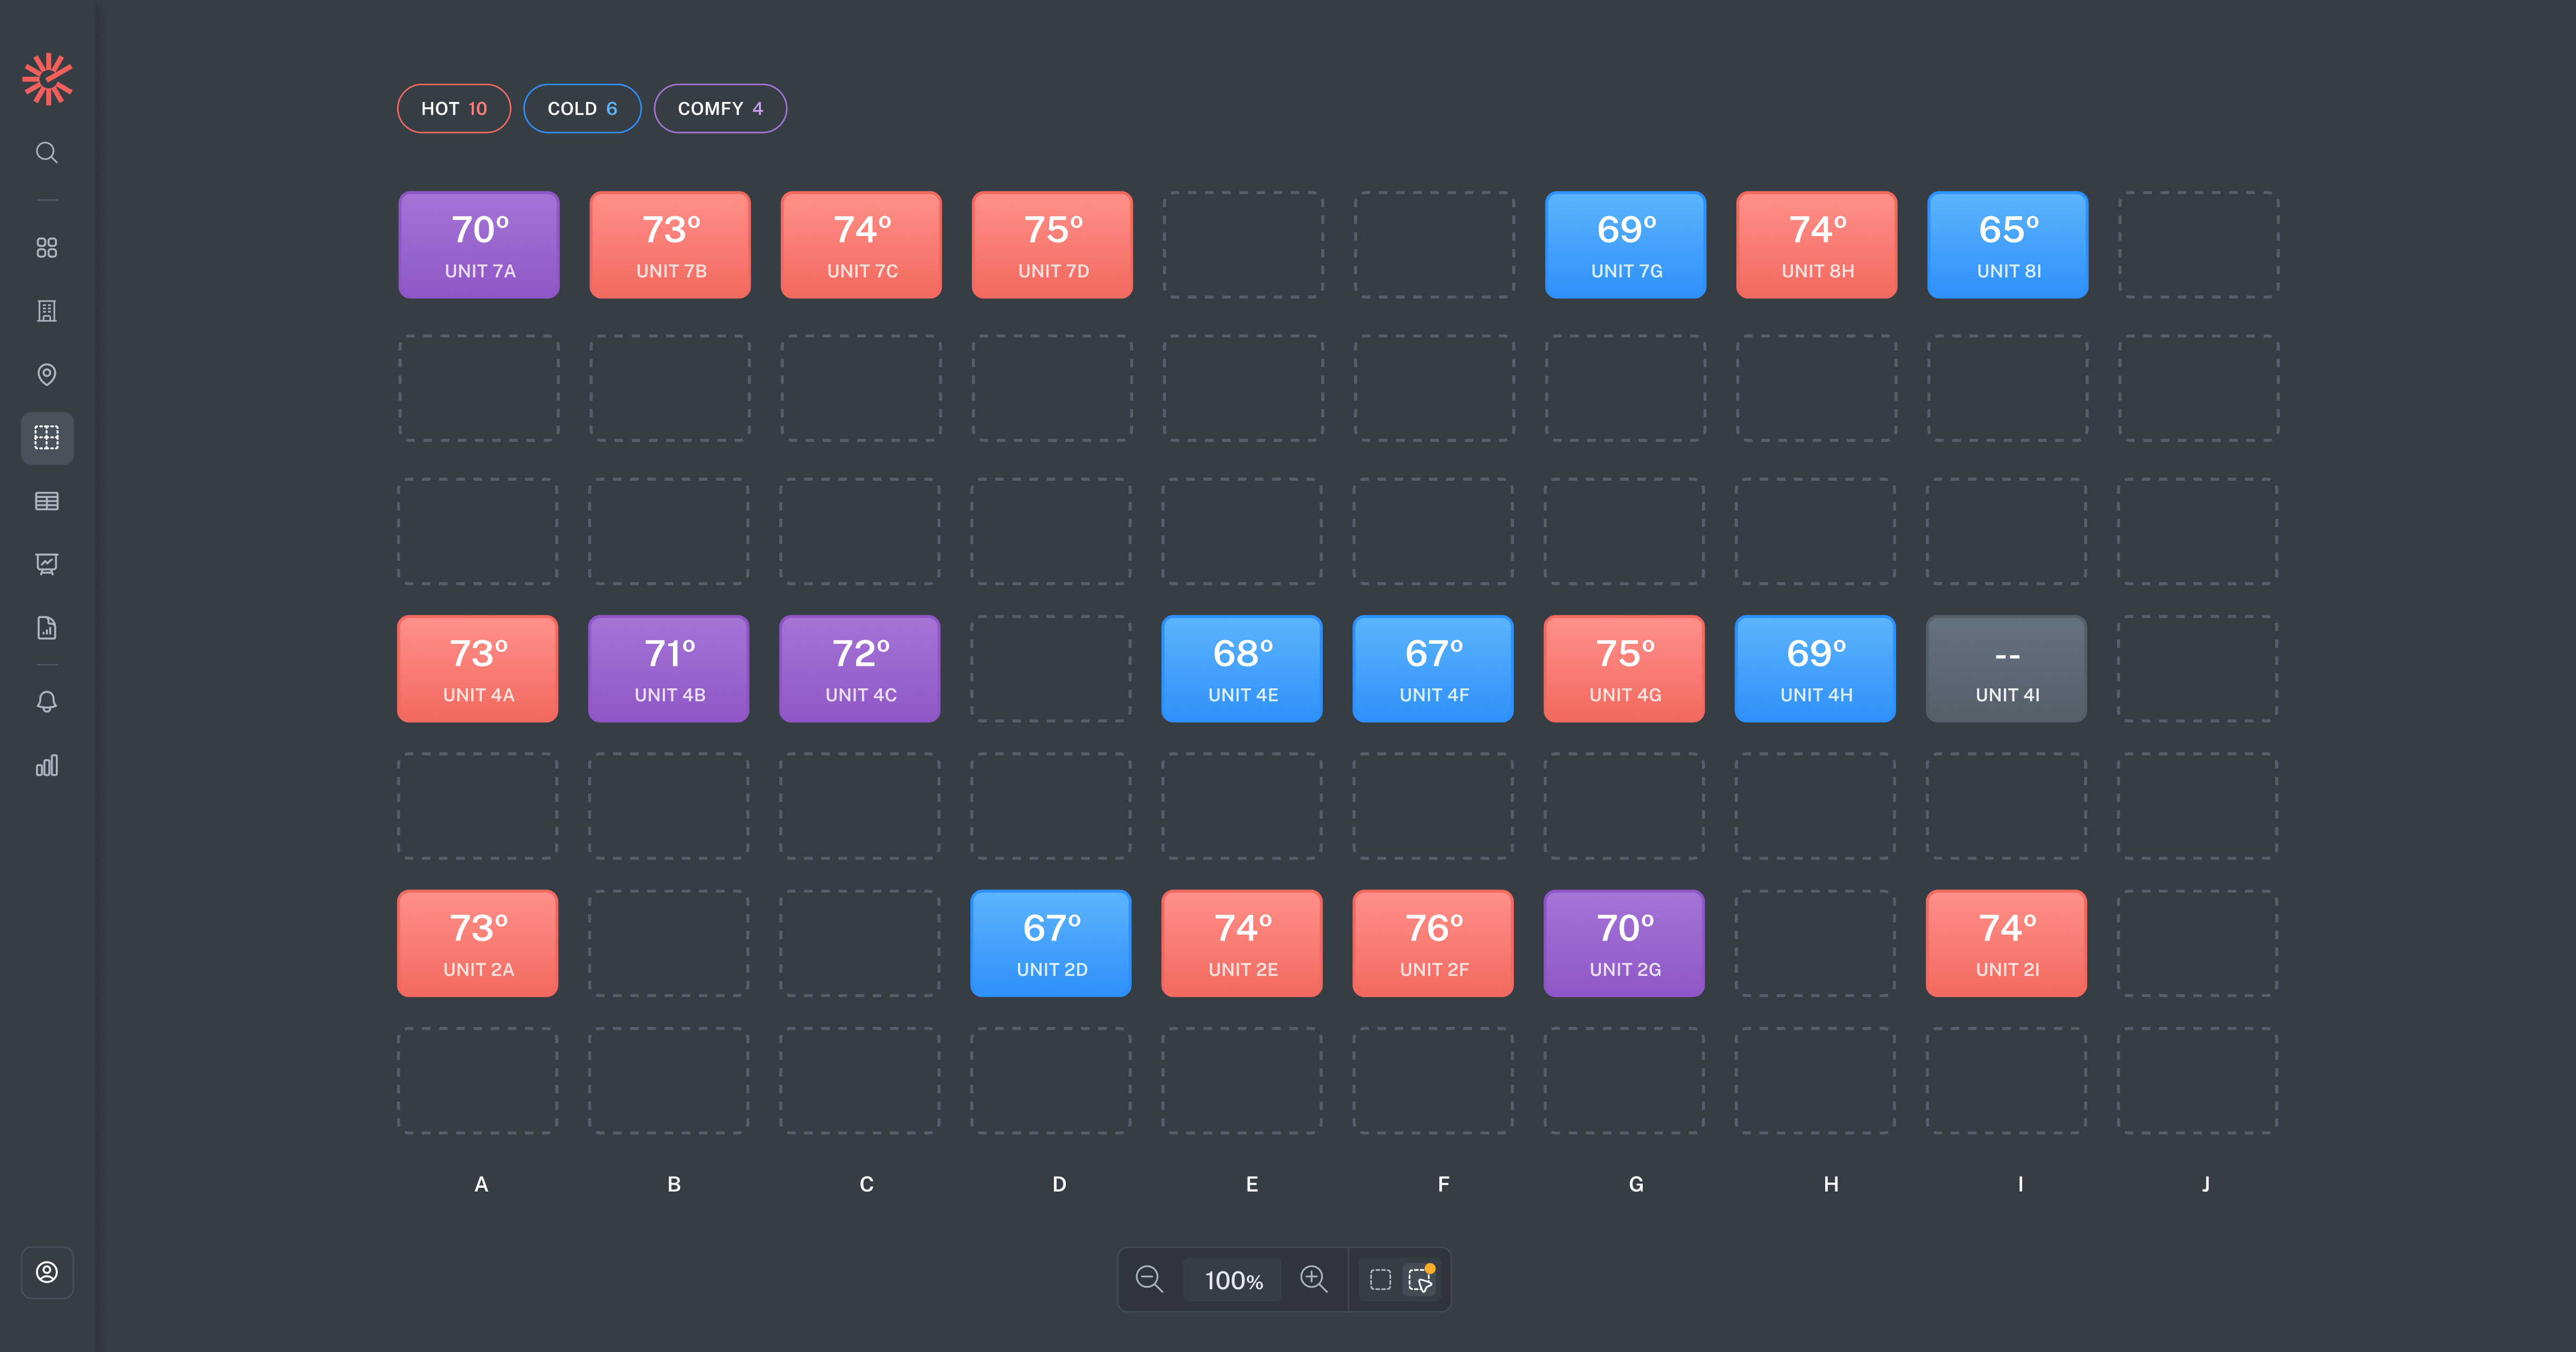
Visualize your entire building at a glance with a map that shows exactly where your sensors are located. Each sensor is color-coded based on its current reading, giving you an immediate sense of temperature distribution, highlighting patterns or problematic sensors.
Instead of scanning through data points, you can now quickly understand what’s happening across the building and pinpoint where your attention is needed.
March 25th, 2026
New
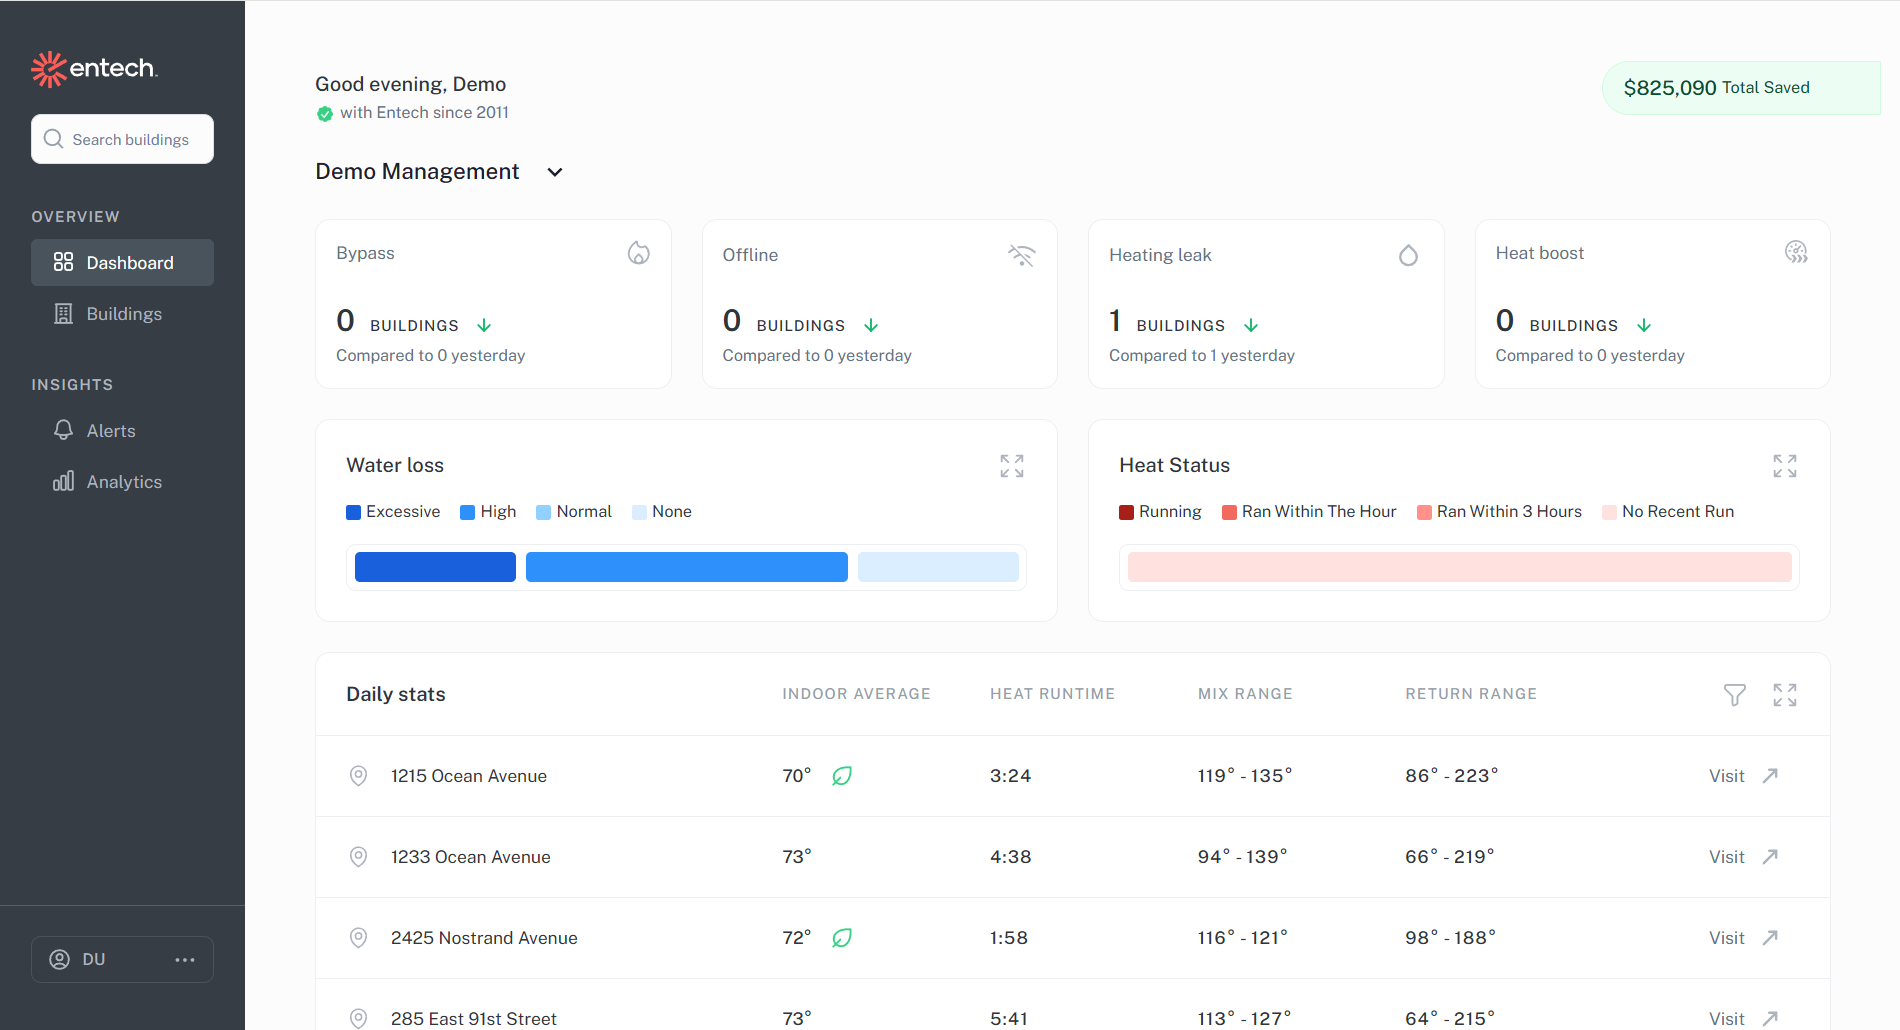
And beautiful, too.
The dashboard surfaces helpful information across your portfolio so you can quickly identify and resolve any issues without digging through multiple views.
See bypassed or offline buildings, monitor water loss and heat status at a glance, and view daily metrics easily to stay on top of building performance.
March 25th, 2026
New
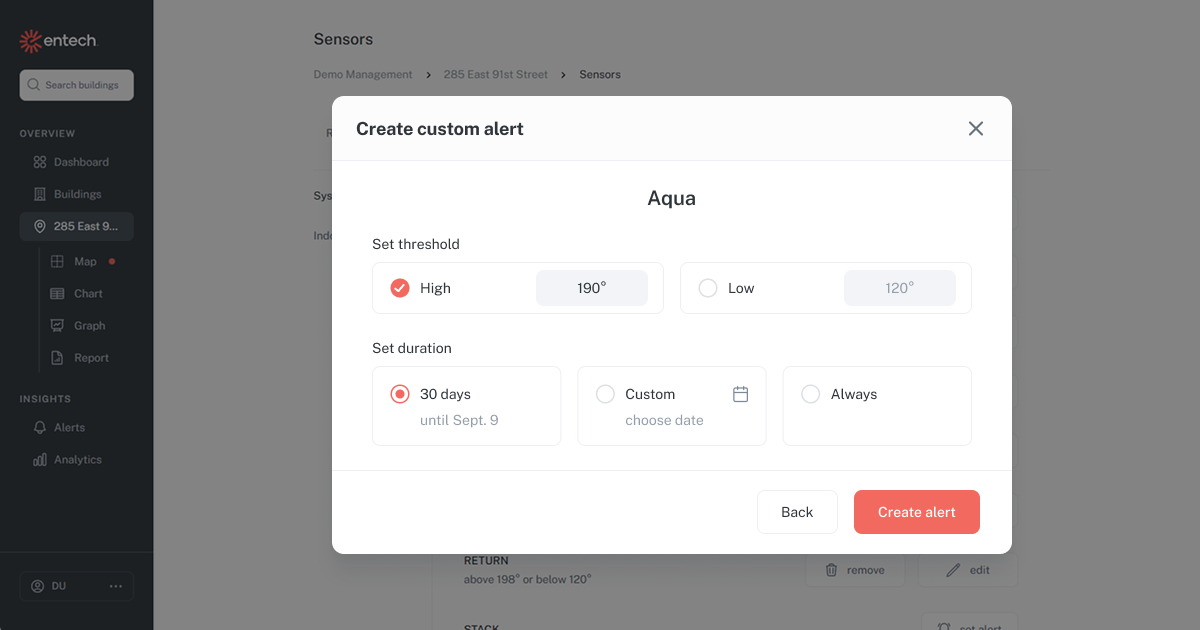
This new feature allows you to set thresholds for the sensors that matter most in your buildings, whether system sensors like aqua or return, or individual apartment sensors.
Receive real-time email alerts when readings go out of range, with the flexibility to keep alerts active for a custom window so you can get the insights you need to catch issues early on.